Mumbai Real Estate Market Analysis for Q1 2023
In the first quarter of 2023, customer searches for properties in Mumbai are generally down. Malad, Kandivali, and other western suburbs like Andheri West, Borivali–Dahisar, Jogeshwari West and locations outside Mira Road, on the other hand, saw strong demand.
Are you searching for new projects in dadar?
Mumbai’s residential real estate saw a 2.4% QoQ fall in demand in the first quarter of 2023. (searches). The supply (active listings) & average property rate in the city, however, saw increases of 0.8% and 2.2% quarter over quarter, respectively.
Mumbai Real Estate Market: Study of Demand and Supply
Based on supply and demand, Malad and Kandivali continue to hold the top spots. Malad and Kandivali experienced the biggest housing demand in Q1 2023. Aside from Jogeshwari West, Andheri West, Borivali-Dahisar, & areas beyond Mira Road, other western suburbs also experienced strong demand and supply because of their proximity to commercial office spaces, reasonable prices, and improved connectivity as a result of the opening of metro lines 2A and 7.
In Q1 2023, the demand & supply for two bedrooms made up 44% of the total. A combined 75% of demand & 72% of supply for 1 & 2 BHK units showed that demand and supply were closely matched.
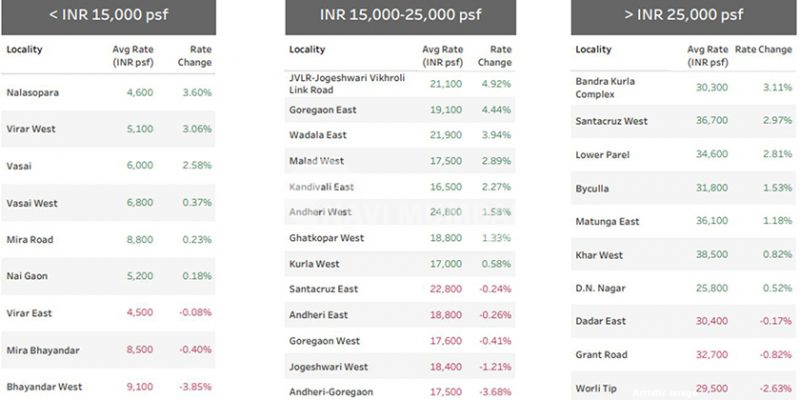
Demand and supply for houses quoting INR 15,000–25,000 per square foot (psf) rates accounted for 47% of each. Followed by properties quoting.
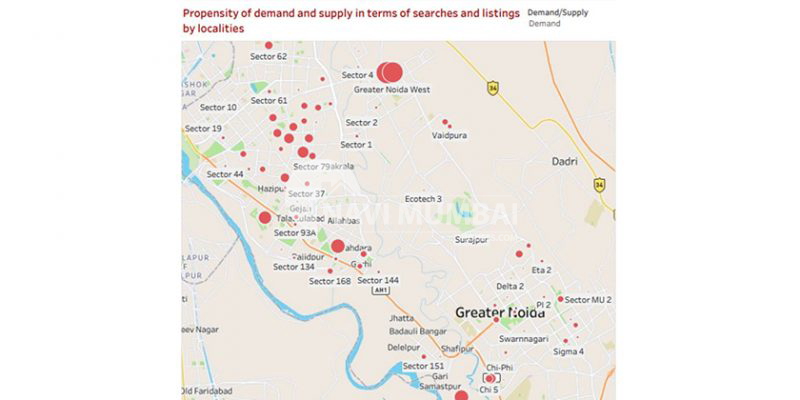
Note: The important locales of the city are shows on the map above. And the size of the bubble represents the demand (consumer preference) and supply (current listings) for houses in those areas in Q1 2023.
Mumbai Real Estate Market Study
Affordable micro-markets including Virar West (3.1%), Nalasopara (3.6%), and Vasai (2.6%) experienced increases in their corresponding average rates.
Kandivali East (2.3%), Malad West (2.9%) & BKC (3.1%) all saw increases in their respective average rates as a result of better metro connectivity.
Note:
- The size of the bubble represents demand, as determined by the number of local property searches conducted in Q1 2023.
- The colour of the bubble symbolizes the change in price for the first quarter of 2023. With green denoting an increase in price and red denoting a fall.
Note:
- The list of the cities’ major neighbourhoods is shown above, along with data on the average rate & QoQ rate fluctuations for Q1 2023.
- After removing any outlier properties that might have an impact on the average price, the locality rate is calculated by averaging the rates of all properties within a location in multi-storey & builder floor segments.
- The three tables above group the areas into different rate categories.
- The colour of the figures depicts the change in price during the first quarter of 2023. With green denoting an increase in price, red denoting a reduction in price, and grey denoting neutrality.
Mumbai Property Market Overview
Home purchasers’ enthusiasm in Mumbai has been lower due to excessive project completion delays. According to statistics compiled by MahaRERA, 988 projects’ registrations in Mumbai. Have expired as a result of the respective developers missing their completion date and failing to request extensions.
Early this year, the opening of metro lines 2A (Dahisar to Andheri West DN Nagar) and 7 (Dahisar East to Andheri East) is anticipate to have a good effect on nearby micromarkets. The auspicious occasion of Gudi Padwa, which is normally a significant sales booster. Is another factor that the developers are predicting will enhance sales.
You’re looking for Projects in Andheri we have the Best Properties In Mumbai Like Ready to Move:https://navimumbaihouses.com/properties/search/andheri-/
If you want daily property update details please follow us on Facebook Page / YouTube Channel / Twitter
